Current Project
Coverage Map Redesign
I led the complete redesign of the T-Mobile Coverage Map for both web and mobile platforms, guiding the project from initial research through to the final design of the first phase, which was successfully handed off to the development team. I conducted extensive UX research to identify opportunities for improving the current coverage map and created high-fidelity designs incorporating new user experience insights. Currently, I am working on the second phase of the project, building upon the foundation of the first phase to further enhance the user experience.
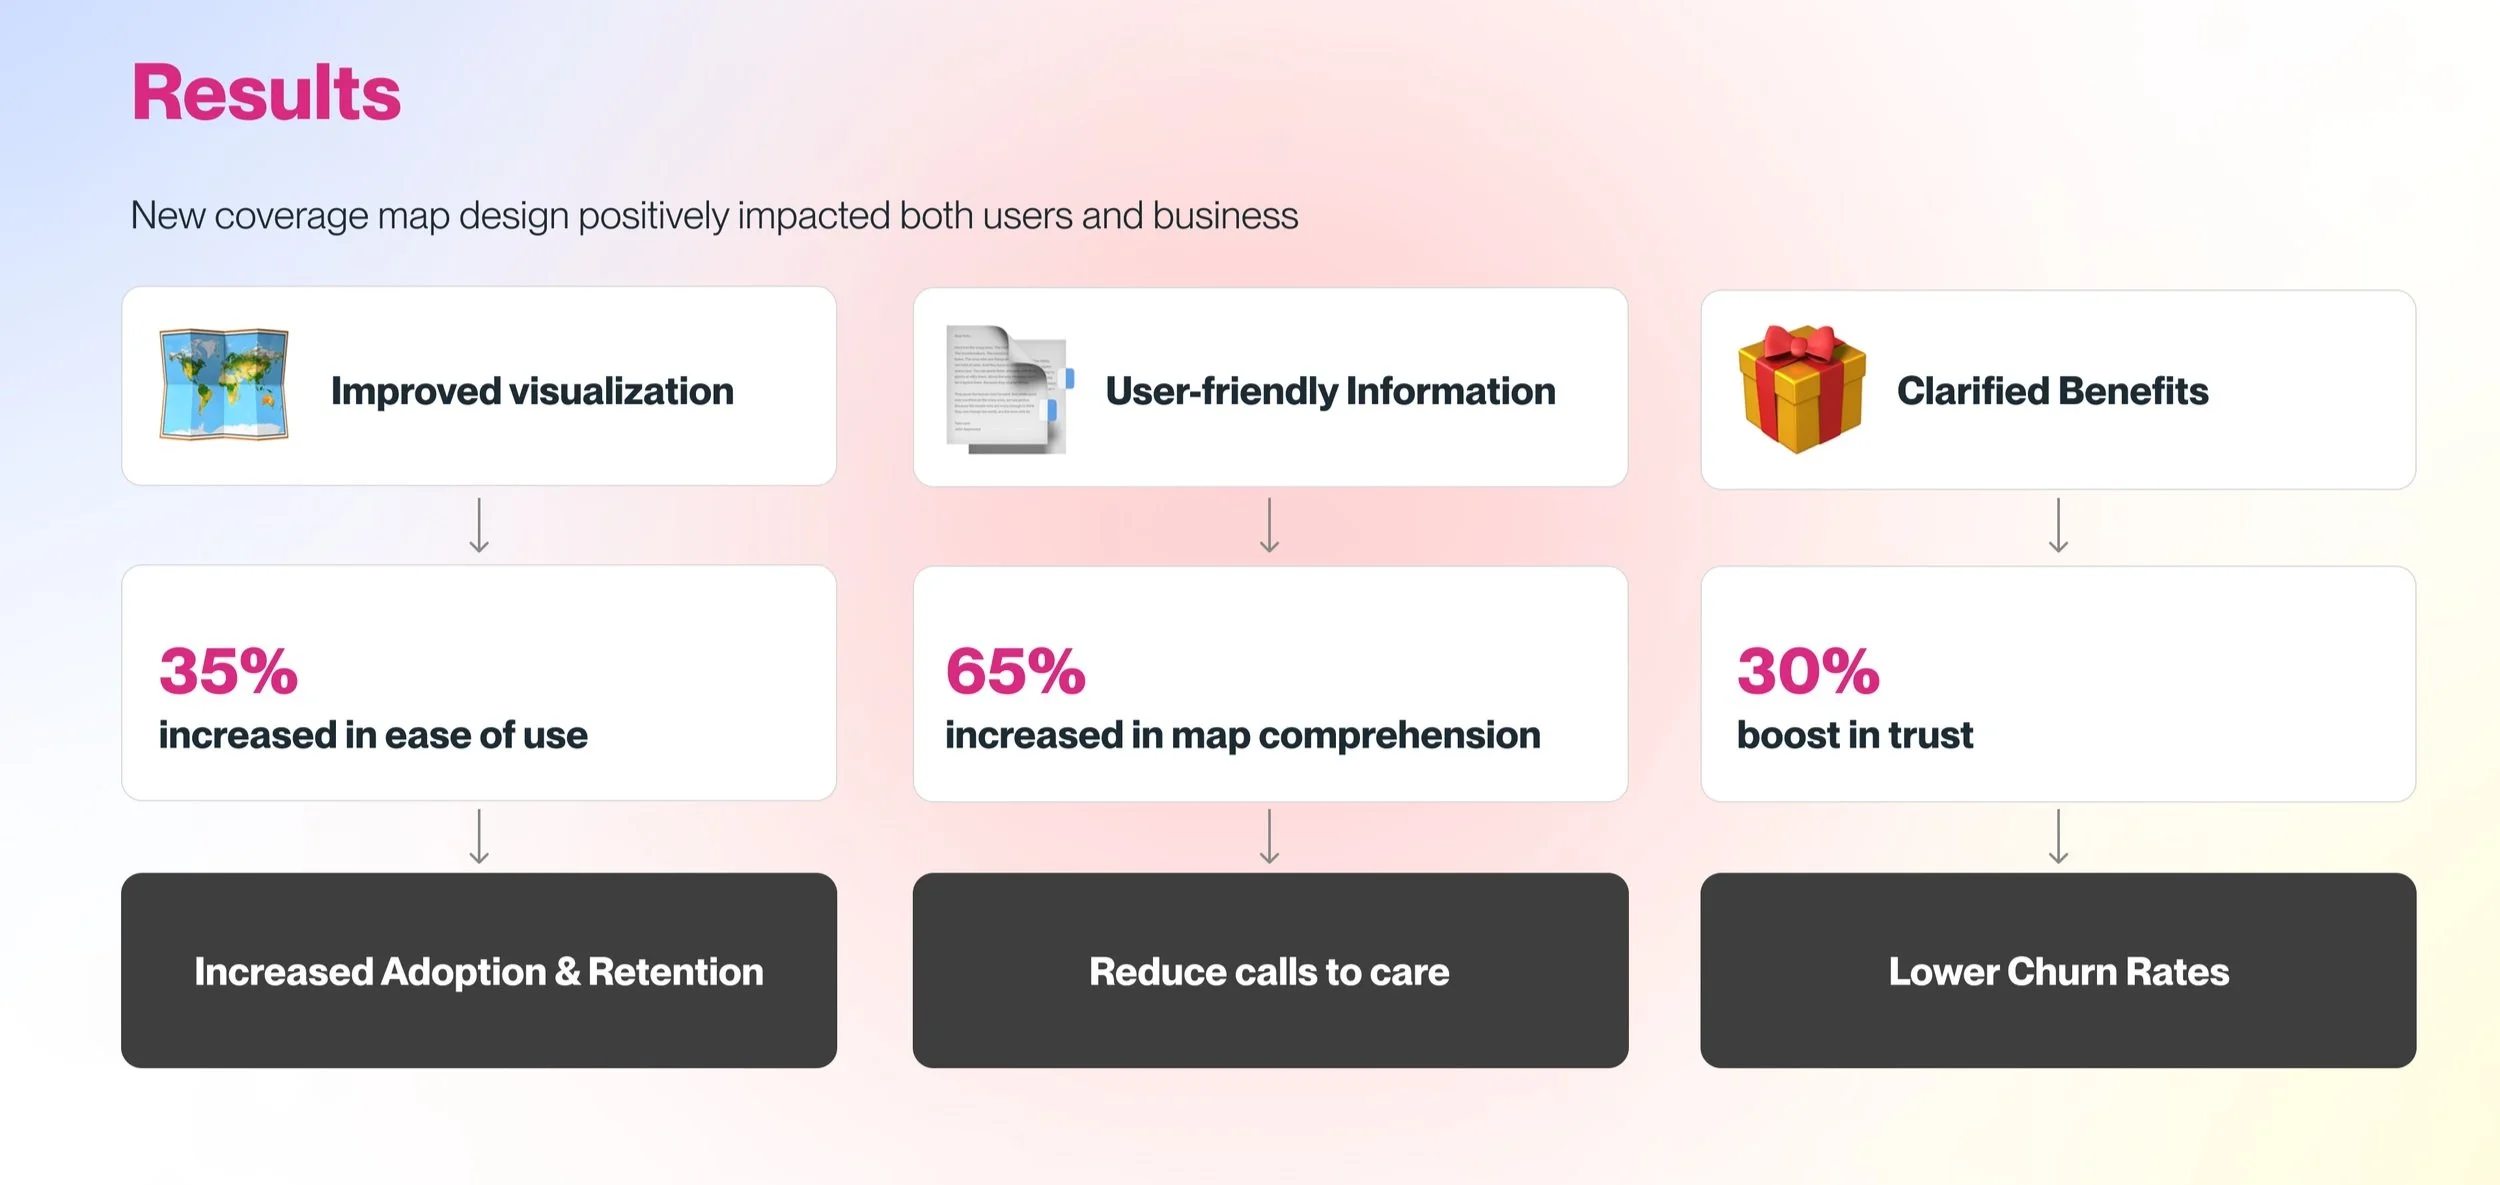
Result: Map comprehensive level increased by 65% and usability increased by 35%
Info
My Role
Product Design, UX Research
Timeline
Oct 2024 - Current
Team
Engineers, PMs, UX Researcher, Design system designer, Accessibility team
Before & After
Improved the entire coverage map user experiences
Map comprehensive level increased 65% and usability increased 35%
Before
After
Before:
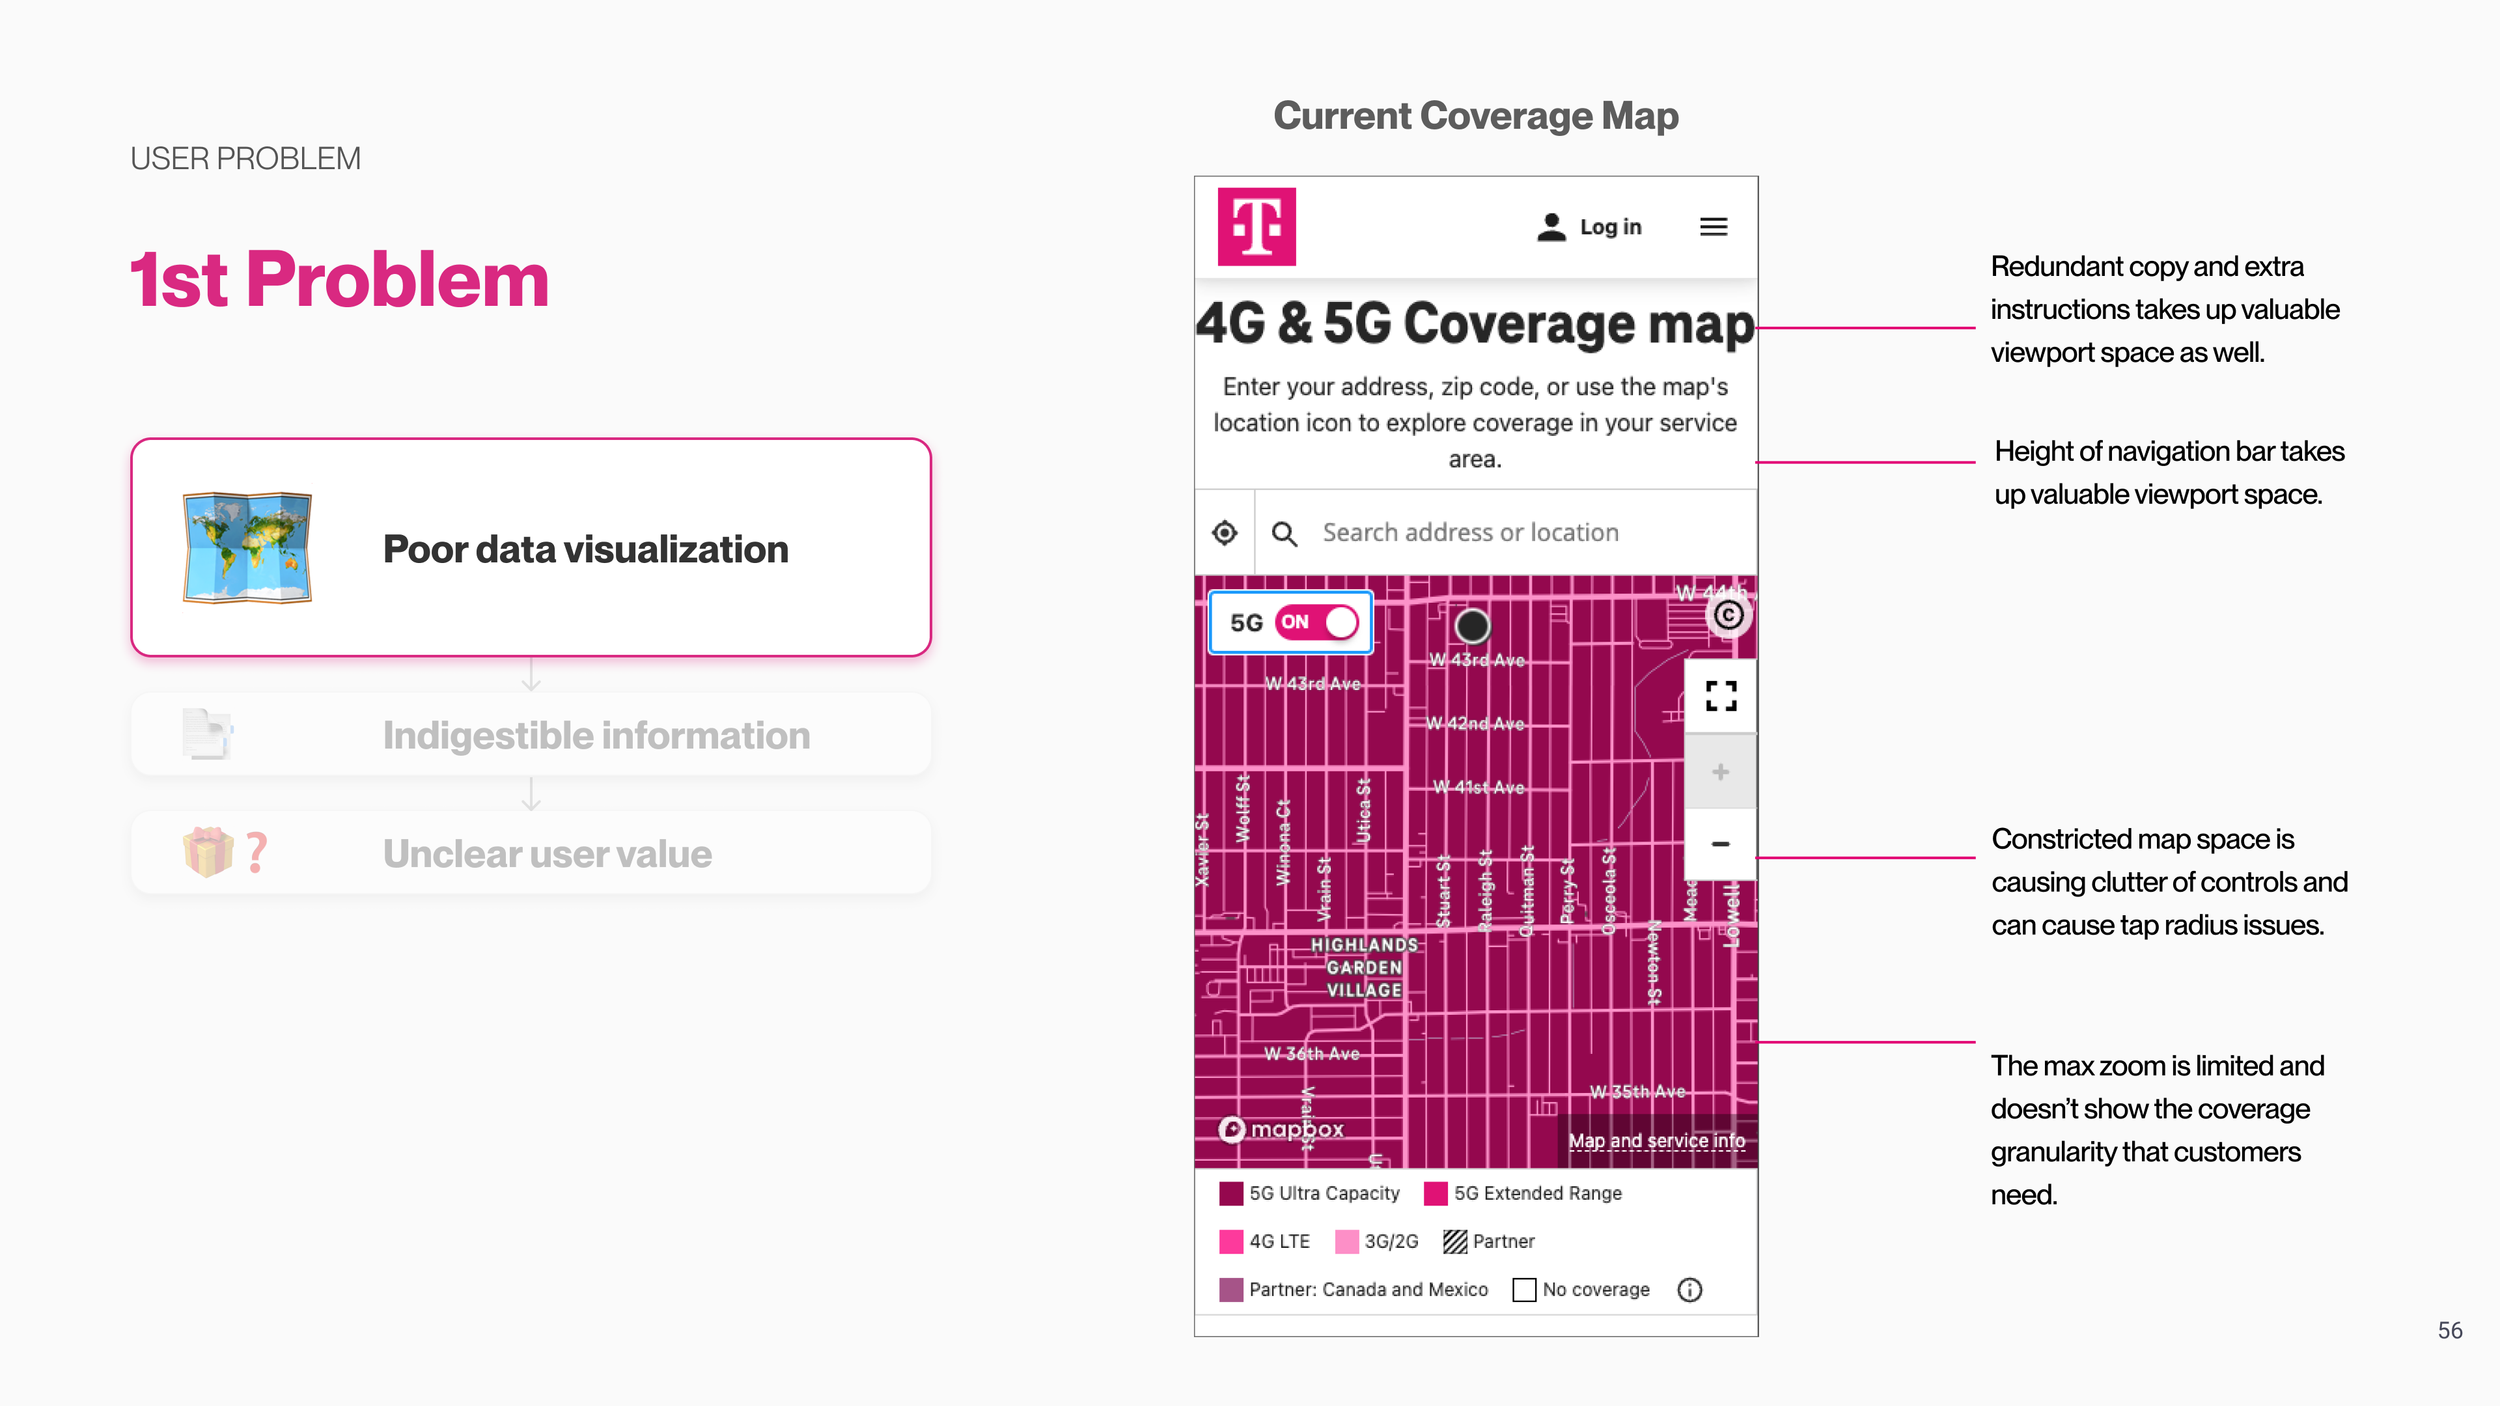
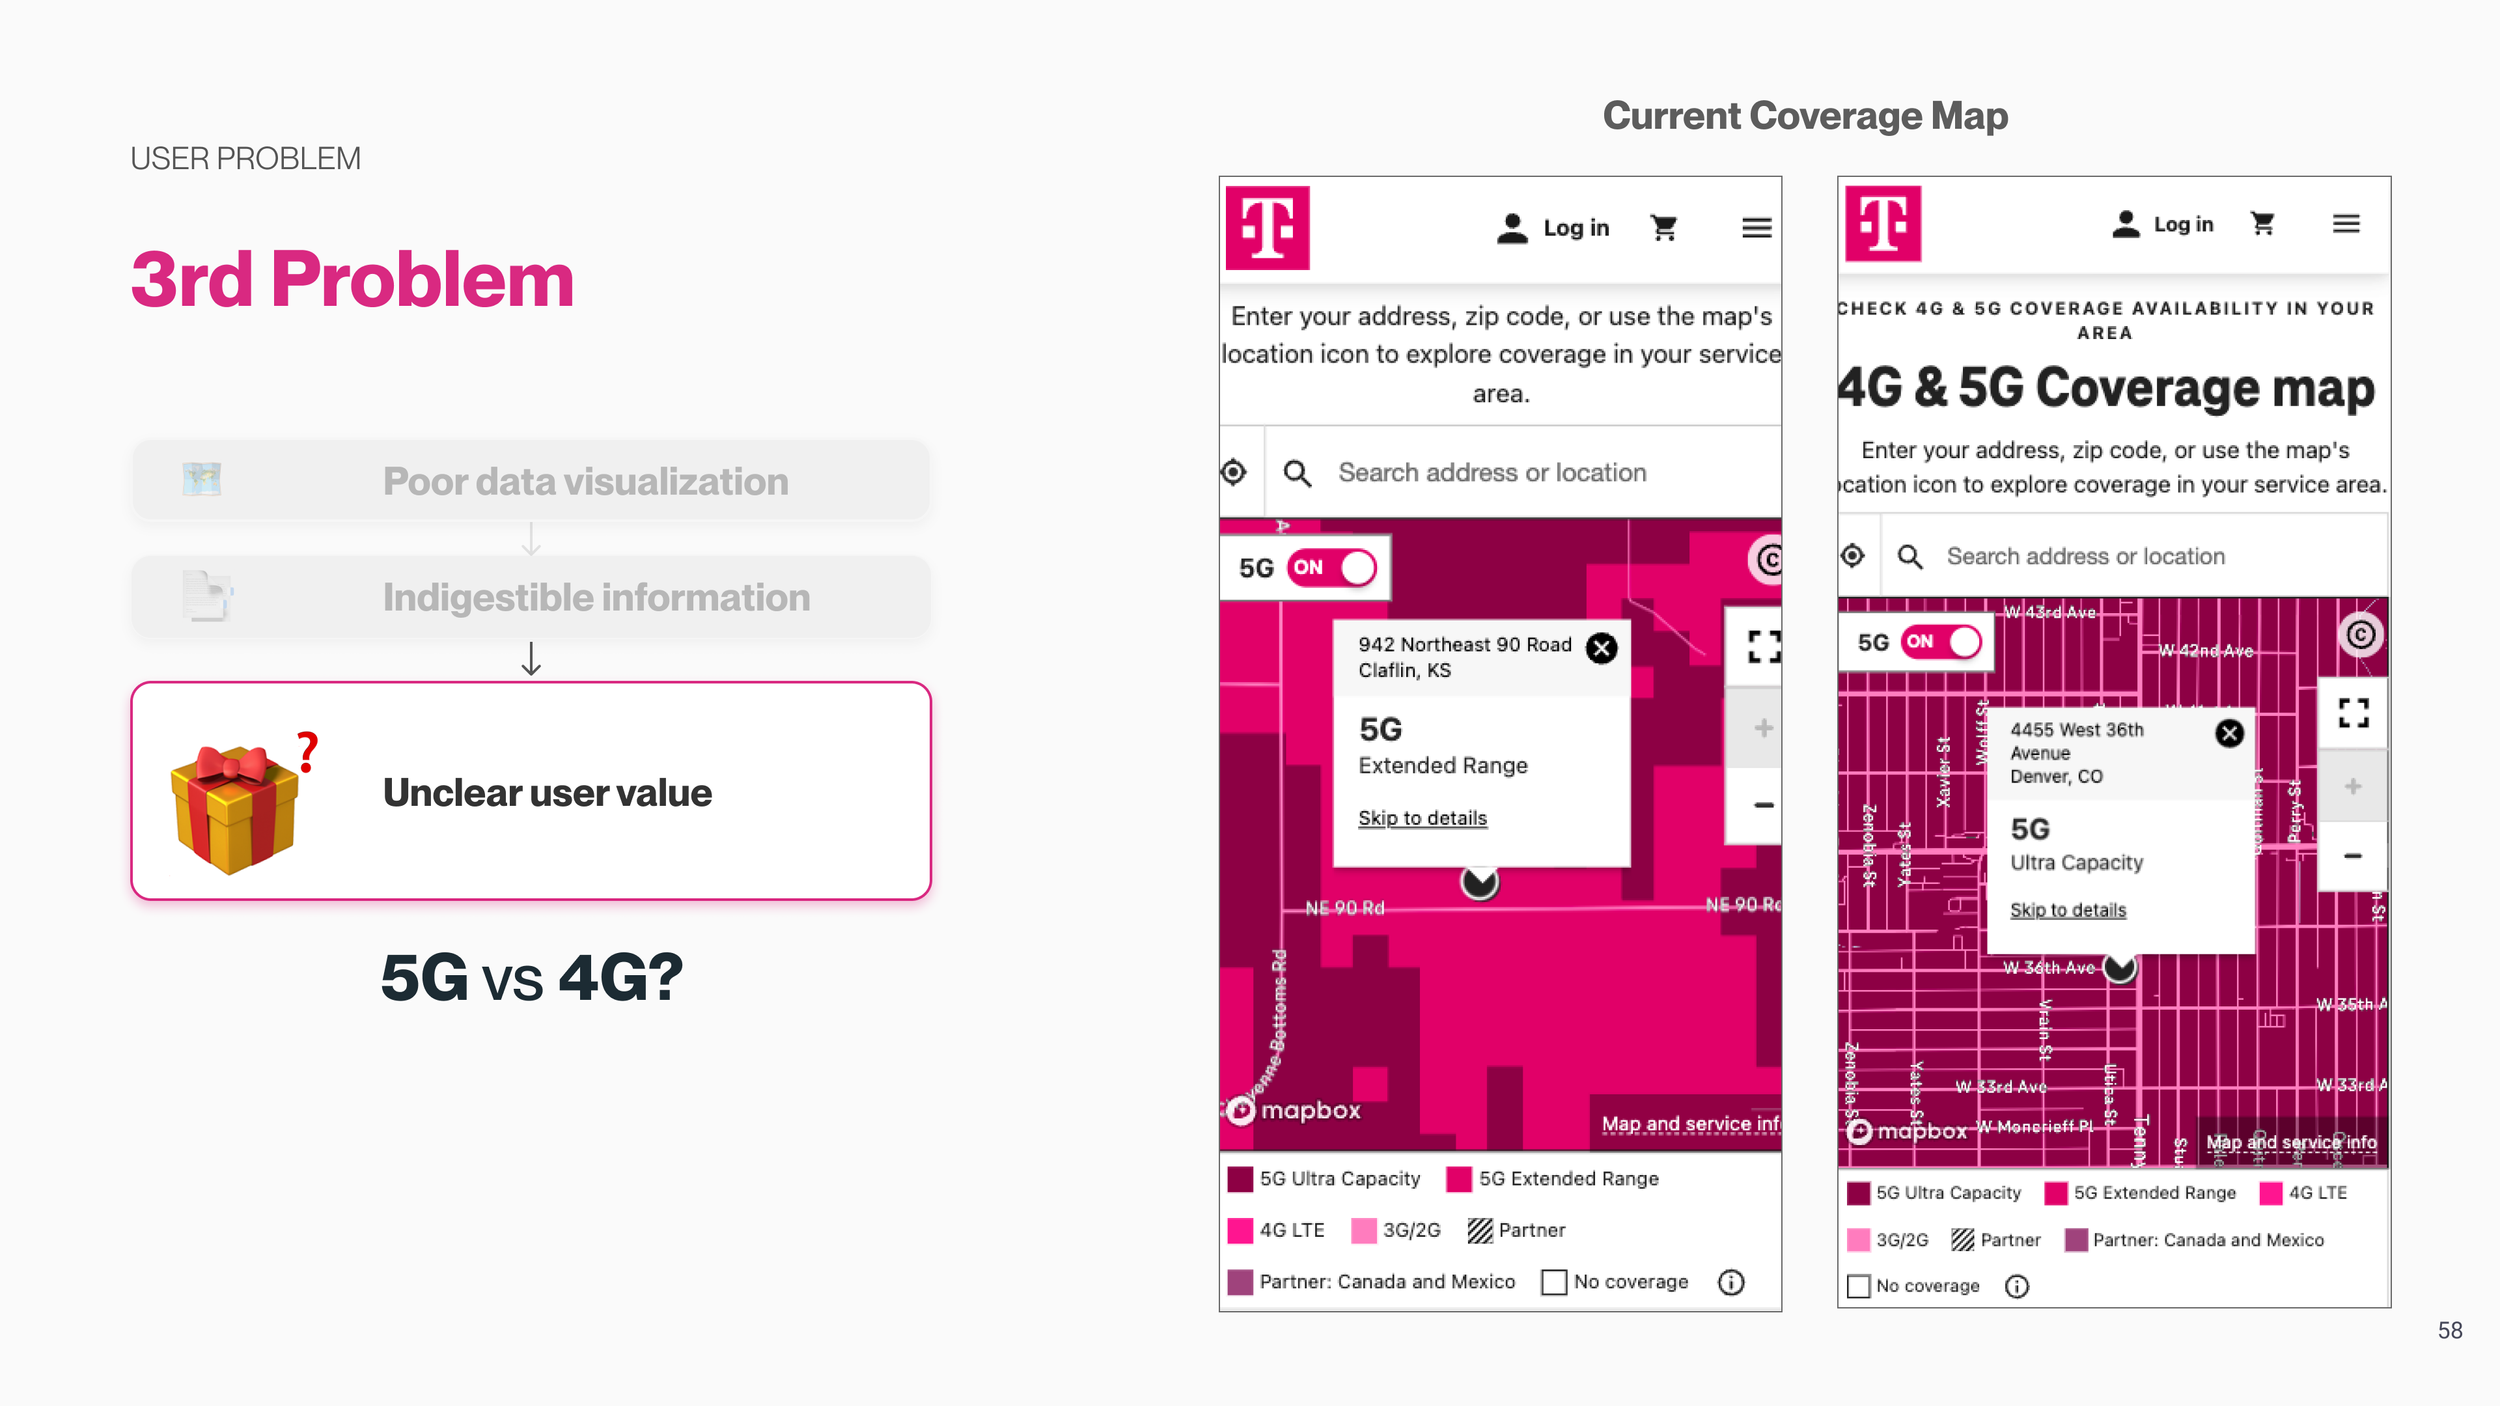
Limited Map Usability: The coverage map was partially obscured by redundant marketing copy, with only half of the screen available for users to explore the map.
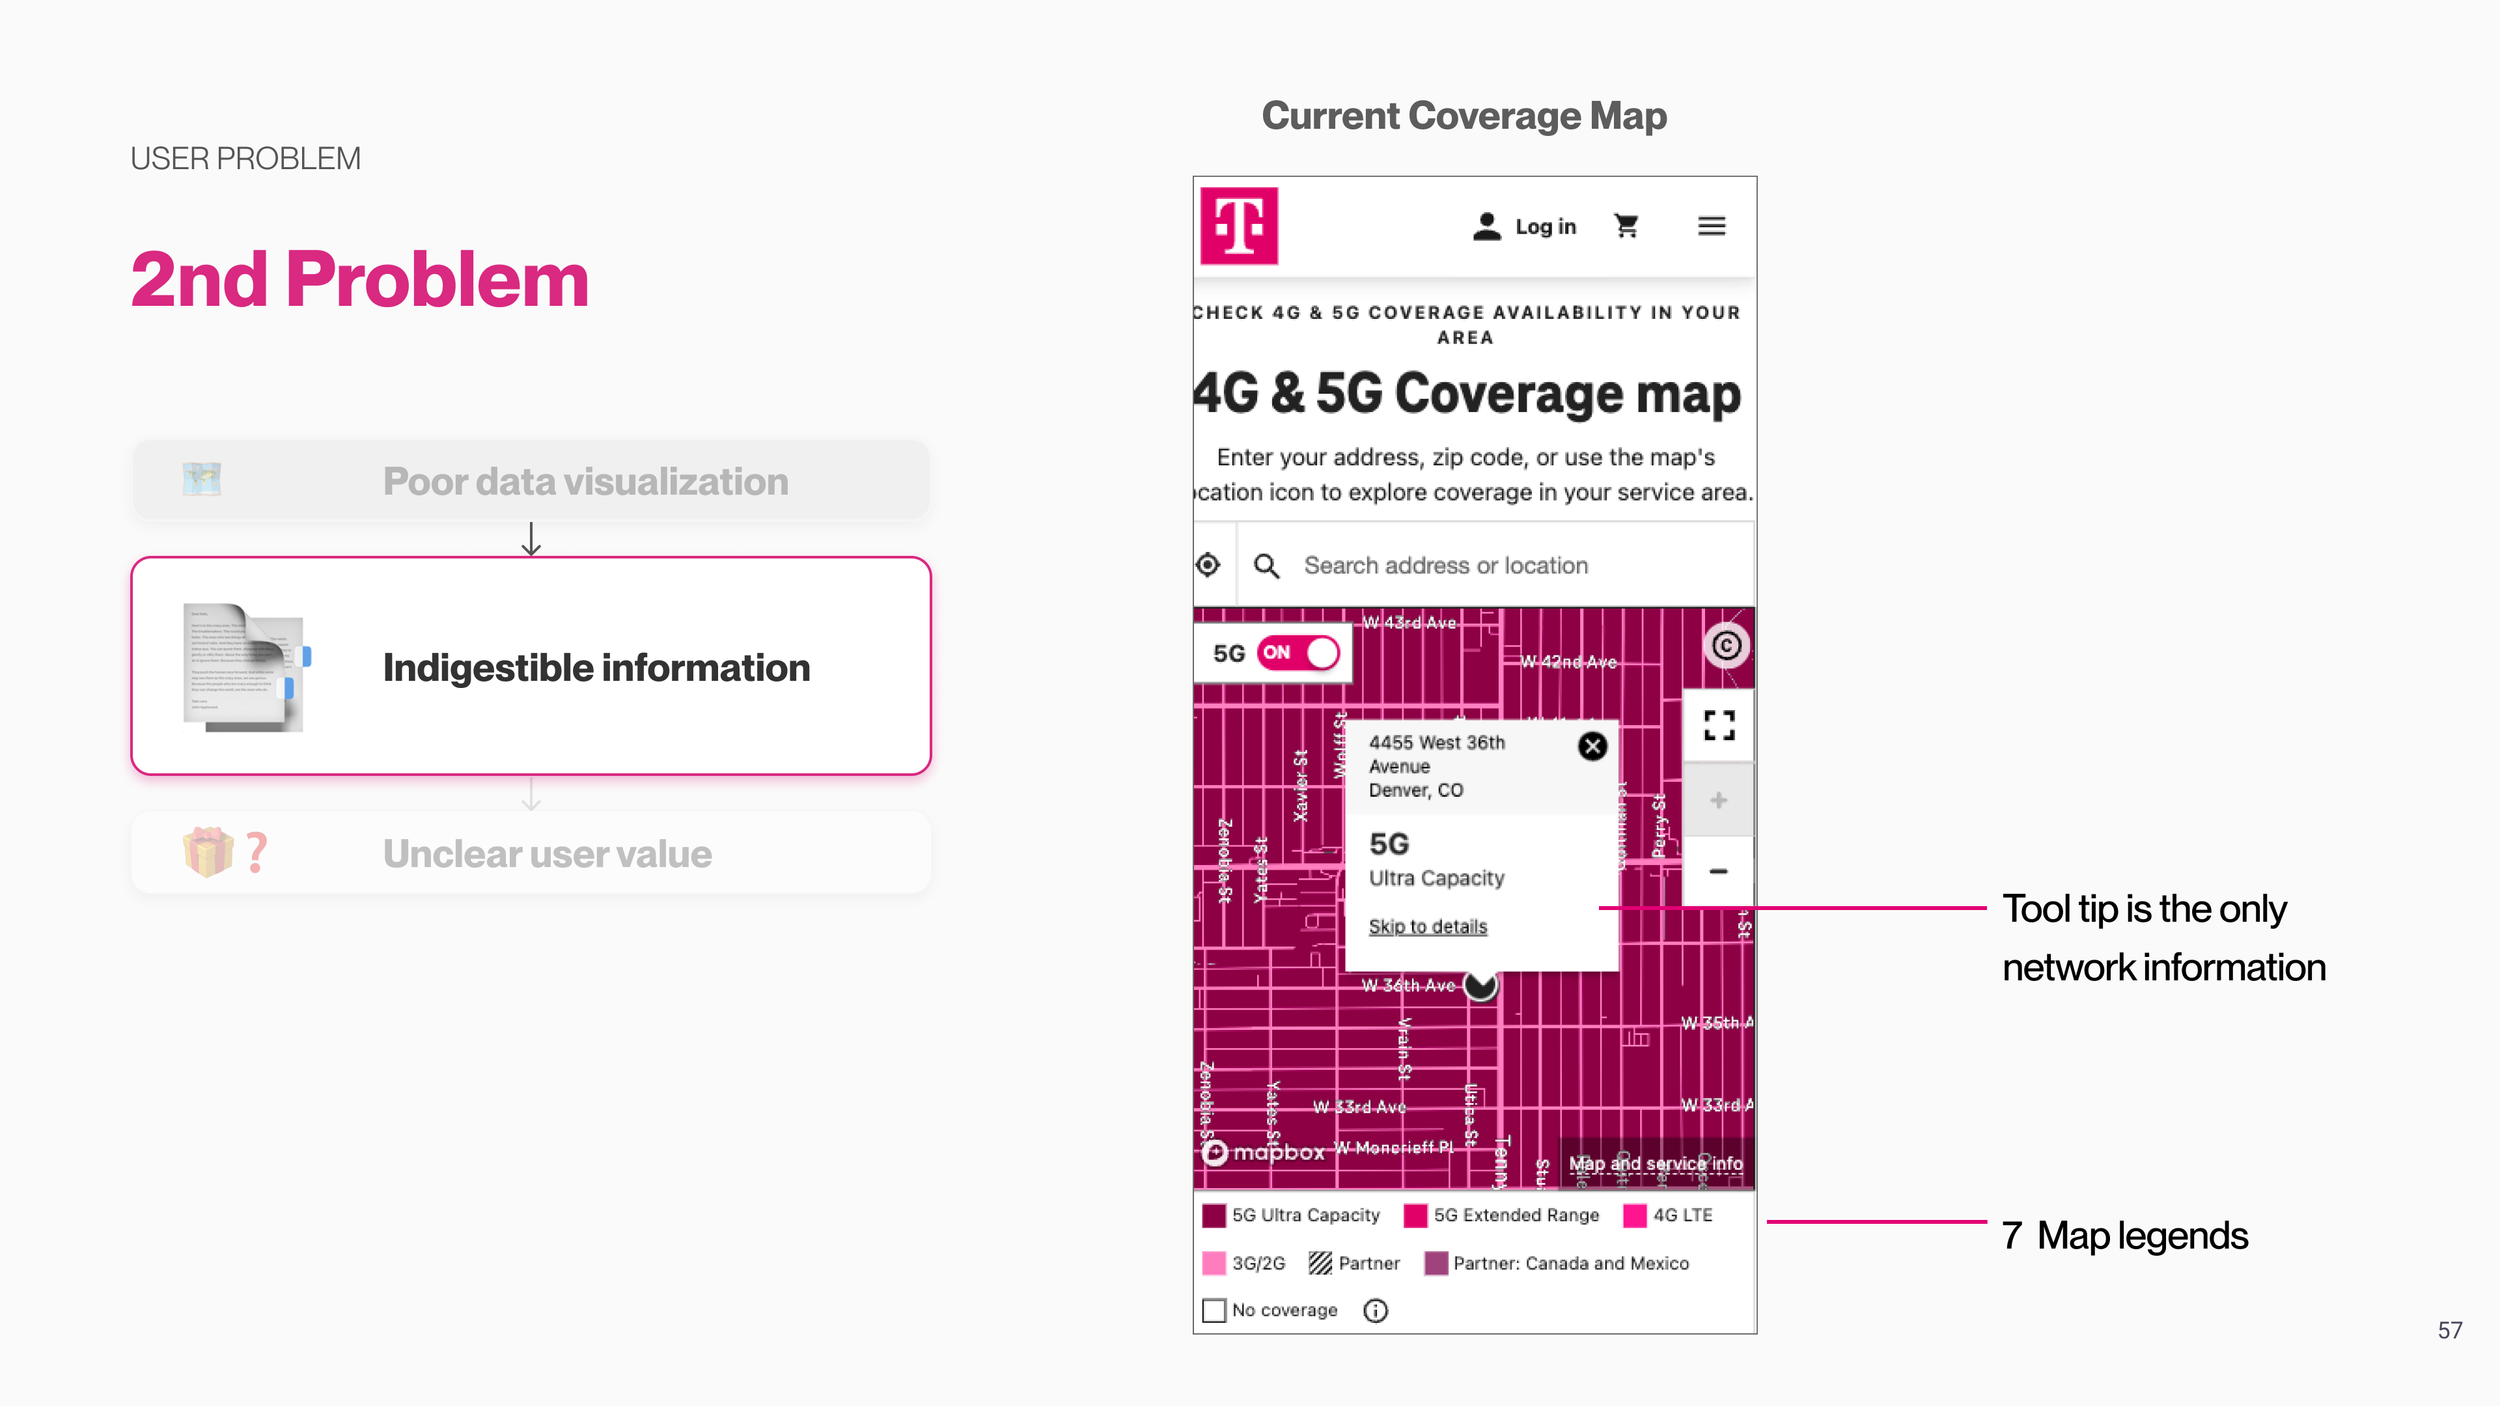
Low Map Comprehension: A large number of map legends, technical jargon, and insufficient explanatory information made it difficult for users to understand the map. This resulted in higher customer support calls and contributed to an increase in the churn rate.
After:
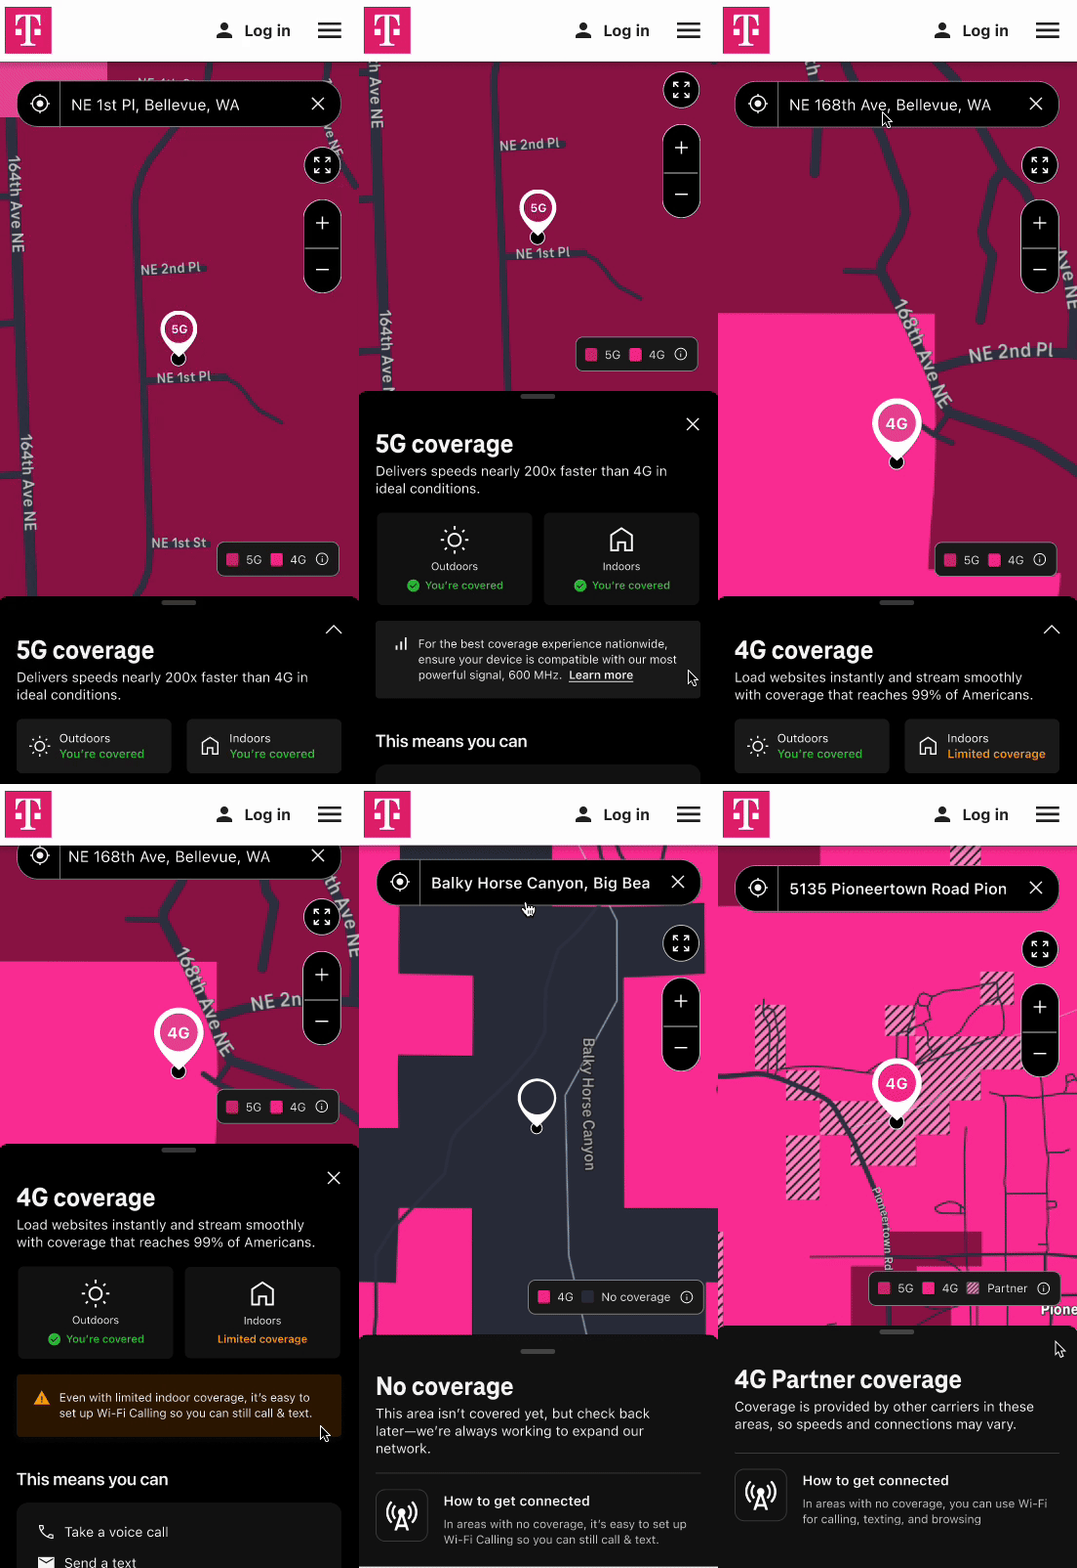
Enhanced Map Usability: Map usability improved by 35% by expanding the coverage map to full screen. Redundant marketing copy was reduced and replaced with dynamic map legends, offering a more streamlined and focused experience.
Improved Map Comprehension: Map comprehension increased by 65% through the introduction of a detailed bottom sheet that provided clear information, including Indoor/Outdoor coverage and user-friendly terminology, making the map easier to understand and more informative for users.
Background
6.2M people visit our coverage map annually, 3.6M prospects visit with the intent to switch to T-Mobile
Business Problem
55% churn rate in first 90 days due to low map understanding
Current T-Mobile coverage map has these business problems:
Customer support overload
High 90-day churn rate
Lack of user empowerment
User Problem
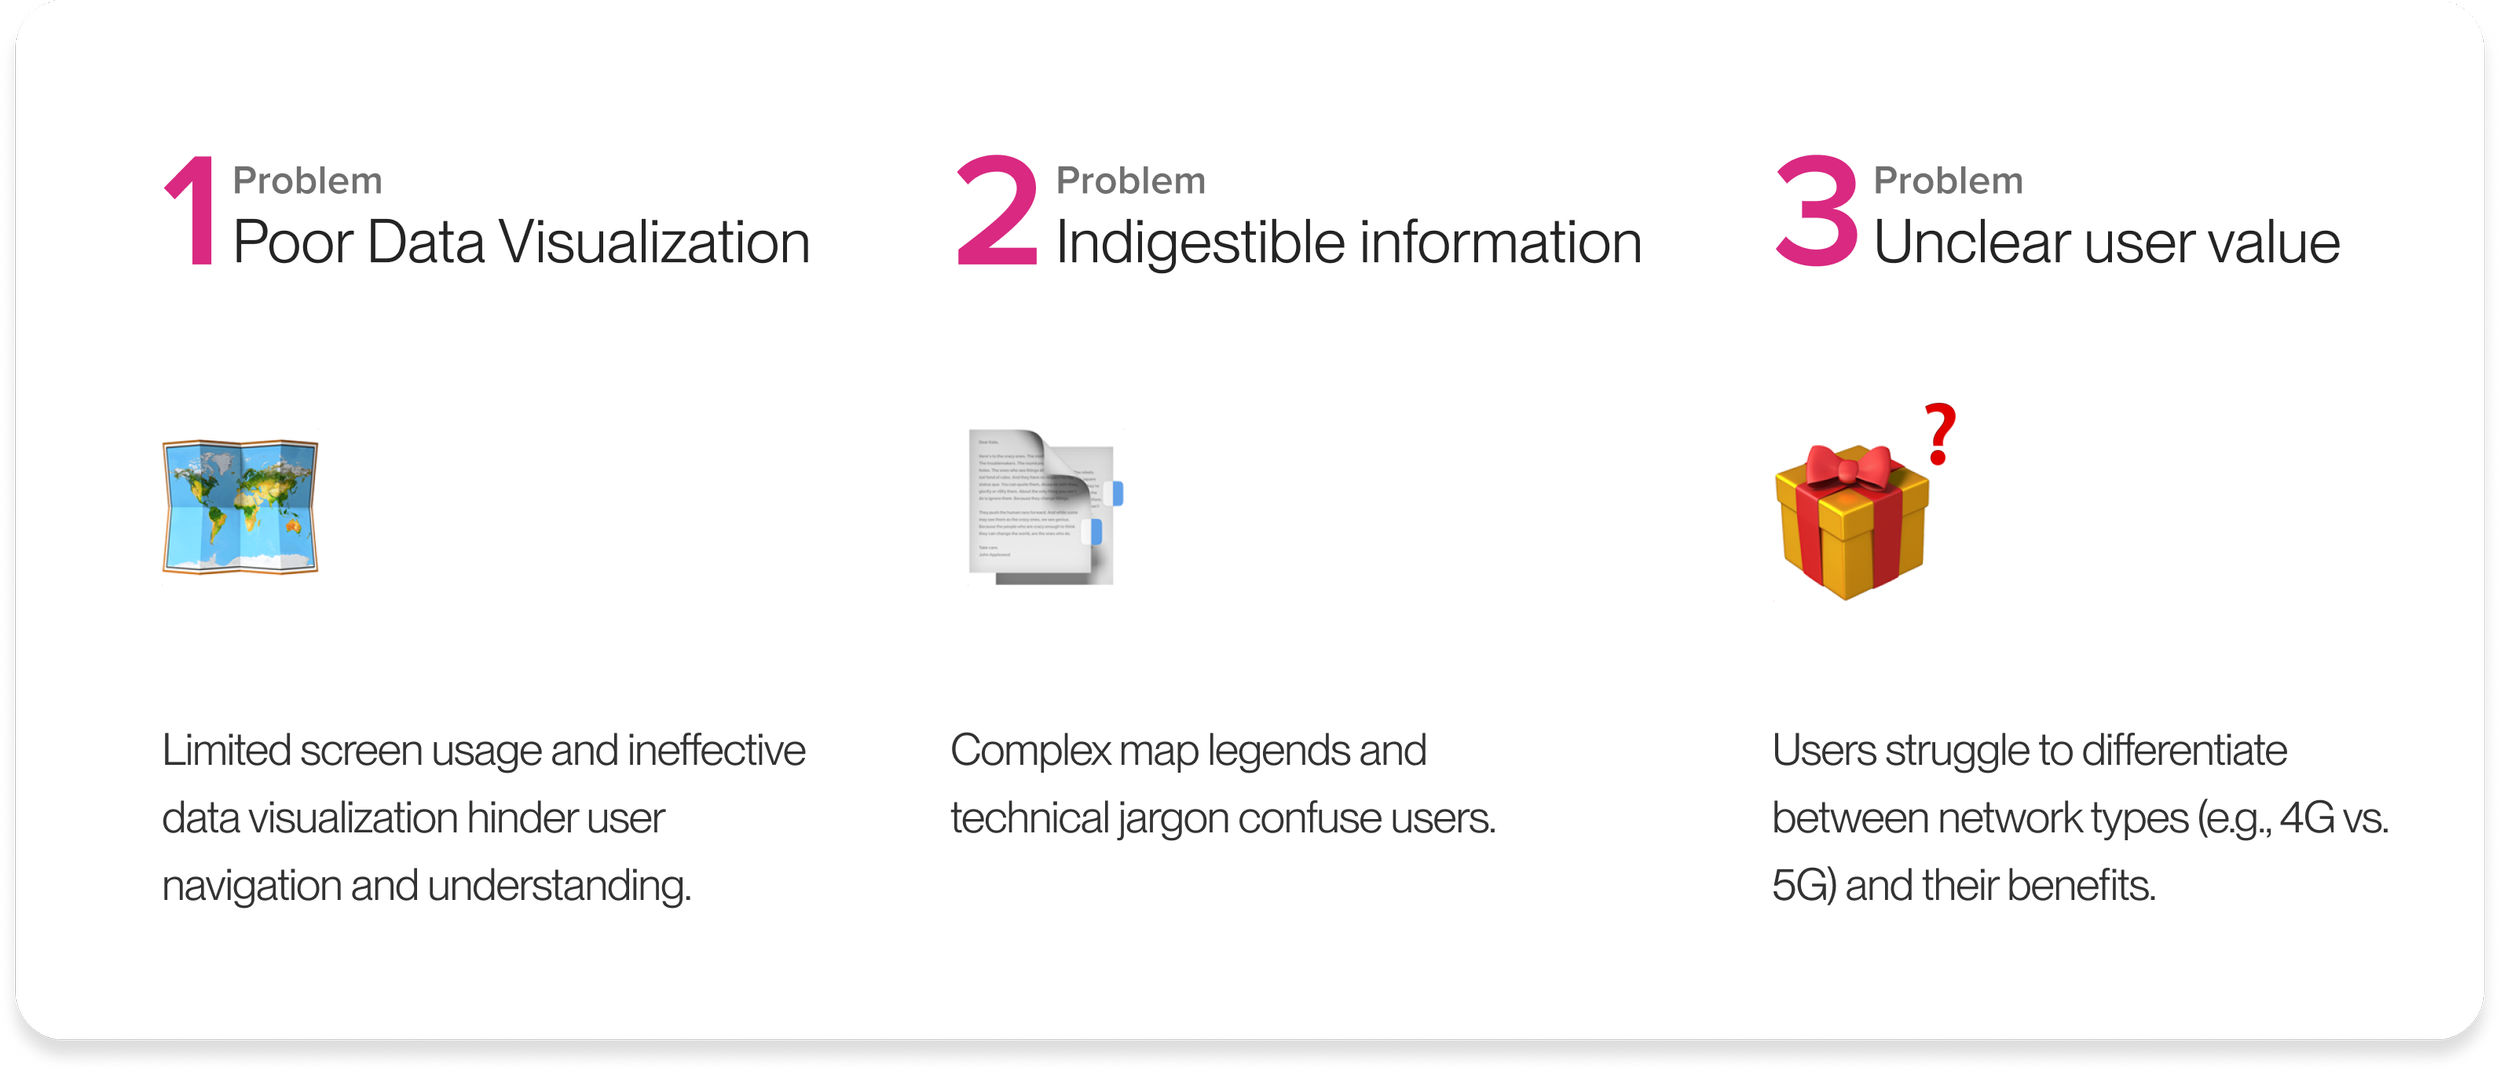
Current Coverage Map’s issue
Mixed UX Research Methods
How we got there?
Design Process
To evaluate our idea quickly through MVP test, I defined key scenarios and features with PM. We had 3 weeks sprint to build fully working demo application including design, development, and QA test.
Multiple iterations based on user testing and stakeholders’ feedback
Since we had limited time to create a fully working demo application, I had to find the balance between implementation effort and user experiences. I worked closely with engineers and pm to discuss feasibility and priorities.
1st solution
I made multiple design iterations based on user testing insights and stakeholders’ feedback including leadership, product, and dev team.
Current coverage map’s issue
Early design iteration for user testing
I made high fidelity prototype for user testing and received feedback from users and stakeholders including the dev, product, and accessibility/ design system team.
Final design for 1st issue
Phase 1: Final design
New design result (KPIs)
Currently, this project is in the production phase!
From Oct 2024 - Current
